For years, digital advertising has lived in a gray area of state tax policy. Ads are created in one place, bought in another, served everywhere — and taxed almost nowhere.
That’s changing.
Washington State recently expanded its retail sales tax to include many digital advertising services, joining a growing group of states reconsidering how digital ads fit into existing tax frameworks. While Washington’s approach differs from Maryland’s standalone digital advertising tax, the signal is clear: states are moving to tax digital advertising based on where it is delivered, not just where it’s sold.
As more states explore similar laws, advertisers, agencies, and ad platforms face a new challenge: accurately determining where ads are actually served — at scale.
The Emerging Patchwork of Digital Advertising Taxes
Washington isn’t alone. Legislators in states like New York, Massachusetts, Rhode Island, Connecticut, and Minnesota have introduced or debated proposals aimed at taxing digital advertising or related digital services.
While the details vary, these proposals share common traits:
- Taxes triggered by where ads are delivered or consumed
- Increased scrutiny on digital services historically treated as non-taxable
- A reliance on location-based sourcing rules to determine tax liability
This shift creates a fundamental operational problem for digital advertising: How do you prove where an ad was actually served?
Why “Location” Is Now a Tax Problem, Not Just a Marketing One
Digital advertising has traditionally optimized for performance metrics — impressions, clicks, conversions. Tax authorities care about something different: Jurisdictional accuracy.
For tax purposes, states increasingly want to know:
- Which ads were delivered to users in their state
- Whether ads crossed county, city, or local tax boundaries
- How much taxable activity occurred inside vs. outside their jurisdiction
Without precise location intelligence, companies risk:
- Over-collecting tax, inflating customer costs
- Under-collecting tax, creating audit exposure
- Inconsistent reporting across finance, legal, and ad operations teams
This is where IP intelligence moves from “nice to have” to critical infrastructure.
Why ZIP+4–Level IP Intelligence Is Essential
Many tax rules — especially sales and use taxes — are applied at the local jurisdiction level, not just the state level. Broad geolocation (country or state only) isn’t enough.
To correctly calculate and allocate digital ad taxes, organizations need:
- Accurate user location at the time an ad is served
- Consistent, auditable location data
- Coverage that scales across billions of ad impressions
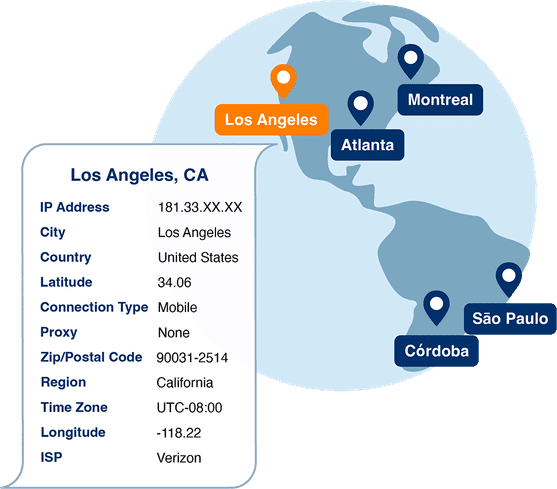
This is where ZIP+4 granularity becomes especially valuable. ZIP code alone can still mask important local tax differences, while ZIP+4–level precision can help organizations better align ad delivery with real-world jurisdictional boundaries.
IP intelligence provides the only practical way to do this without relying on personal data or cookies.
How NetAcuity Supports Tax Accuracy for Digital Advertising
NetAcuity’s IP intelligence enables advertisers, platforms, and service providers to confidently determine where digital ads are delivered — down to the ZIP+4 level.
With NetAcuity, organizations can:
- Determine tax jurisdiction at ad-delivery time
- Map impressions to precise geographic locations without collecting personal identifiers
- Support accurate tax calculation and allocation
- Attribute ad activity to the correct state, county, city, or local tax authority
- Reduce audit and compliance risk
- Use consistent, independently validated location data across finance, legal, and operations teams.
- Future-proof against expanding regulations
As more states adopt digital advertising taxes, location accuracy becomes a reusable compliance asset — not a one-off fix.
Critically, NetAcuity enables this without relying on cookies, device IDs, or personal data, aligning with modern privacy and data-minimization requirements.
Preparing for What Comes Next
Whether or not your state has enacted a digital advertising tax yet, the direction of travel is unmistakable. Tax authorities are catching up to the digital economy — and location accuracy is the foundation of enforcement.
The question is no longer if digital ad taxation expands, but how prepared your systems are when it does.
- Organizations that invest now in ZIP+4–level IP intelligence will be best positioned to:
- Adapt quickly to new laws
- Avoid costly retroactive corrections
- Maintain trust with regulators and customers alike
Digital advertising may be borderless — but taxes are not.
Want to explore how NetAcuity supports jurisdiction-level accuracy for digital advertising and compliance use cases?
Learn more about NetAcuity’s IP intelligence solutions.
FAQs
What are digital advertising taxes?
Digital advertising taxes are state or local taxes applied to revenue from digital ads, often based on where the ads are delivered or viewed, rather than where they are sold or where the advertiser is located.
Which states currently tax or are considering taxing digital advertising?
Maryland currently enforces a standalone digital advertising tax, while Washington State taxes certain digital advertising services under its retail sales tax. Other states — including New York, Massachusetts, Rhode Island, Connecticut, and Minnesota — have introduced or debated similar proposals.
Why does location matter for digital advertising tax compliance?
Location matters because many digital advertising taxes use location-based sourcing rules, meaning tax liability depends on where an ad is delivered to a user, not where the advertiser or platform is based.
How do states determine where a digital ad is delivered?
States typically rely on technical indicators such as IP address data to determine where a digital ad was served at the moment of delivery, allowing tax liability to be assigned to the correct jurisdiction.
Is state-level location accuracy enough for digital ad taxes?
No. Many tax rules apply at the county, city, or local level, meaning state-only location data can result in incorrect tax allocation and increased compliance risk.
Why is ZIP+4–level IP intelligence important for digital advertising taxes?
ZIP+4–level IP intelligence enables organizations to assign digital ad activity more precisely to local tax jurisdictions, supporting more accurate tax calculation, more consistent reporting, and stronger audit readiness.
How can companies determine where a digital ad was served?
Companies determine ad delivery location using IP intelligence, which identifies a user’s geographic location at the time an ad is served, without relying on cookies or personal data.
How does IP intelligence support digital advertising tax compliance?
IP intelligence helps companies map ad impressions to the correct jurisdiction, reduce under- or over-collection of tax, and maintain auditable, consistent location data across finance, legal, and advertising teams.
What risks do companies face if they lack accurate ad location data?
Without accurate ad location data, companies risk tax underpayment, audit exposure, retroactive assessments, and inconsistent regulatory reporting as digital advertising taxes expand.
Is digital advertising taxation expected to expand?
Yes. As states adapt tax laws to the digital economy, more jurisdictions are expected to tax digital advertising, making location accuracy a critical long-term compliance requirement.