In modern media buying, precision is everything. But, it’s also increasingly difficult to achieve.
Between anonymized traffic, proxy usage, and evolving fraud tactics, even sophisticated campaigns can struggle with off-target impressions and invalid traffic (IVT). The result? Wasted budget, distorted performance metrics, and less confidence in your data.
For marketers, agencies, and platforms, the challenge is clear: How do you ensure your campaigns are reaching real people, in the right places, at the right time?
This post breaks down three critical areas:
- The best way to validate geo for campaign measurement
- How to filter anonymized traffic in CTV environments
- What geo checks reduce false positives when blocking out-of-market viewers
Along the way, we’ll outline a smarter, more scalable approach to improving media quality without sacrificing reach.
The Hidden Cost of Off-Target & Invalid Impressions
Off-target impressions aren’t always obvious. Campaigns can appear to perform well on the surface while quietly delivering impressions to users outside your intended geography, non-human traffic (bots or emulators), and masked or anonymized connections.
In CTV environments, the issue becomes even more complex. Signals are limited, identity is often obscured, and server-side ad insertion (SSAI) can make validation more difficult.
Invalid impressions typically stem from:
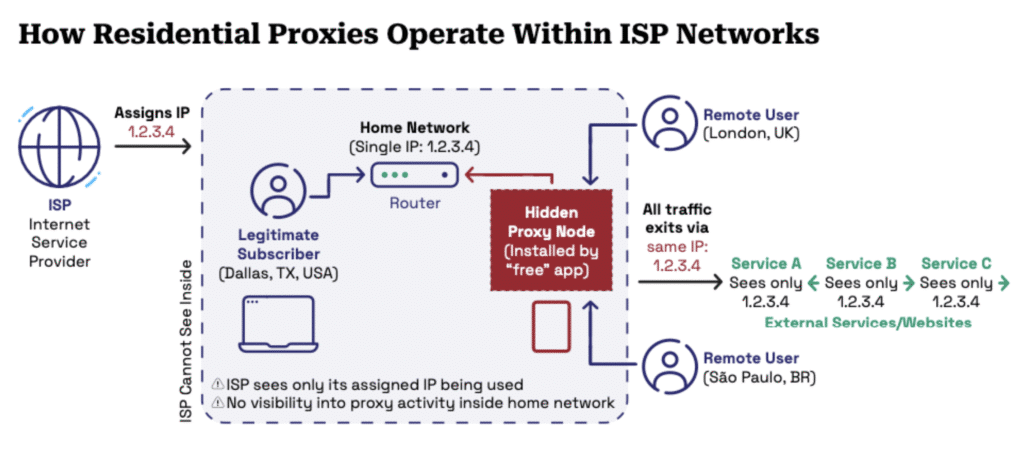
- Data center traffic posing as residential users
- VPNs and proxies masking true locations
- Spoofed devices generating fake ad requests
Even a small percentage of invalid or mis-targeted impressions can skew results, impacting attribution, optimization, and ultimately ROI.
Best Way to Validate Geo for Campaign Measurement
Geo-targeting is foundational to nearly every campaign. But validating that geo, accurately and consistently, is where many strategies fall short.
Move Beyond Basic IP Targeting
Relying on raw IP data alone is no longer enough.
Today’s digital ecosystem includes:
- Shared IP environments (carrier-grade NAT)
- Frequent IP changes on mobile networks
- Widespread VPN and proxy usage
To improve accuracy, geo validation needs to incorporate multi-signal intelligence, including:
- IP-based location (country, region, city, ZIP/postal code)
- Connection type (residential vs. hosting provider)
- Proxy and VPN detection signals
This layered approach helps distinguish between a real user in your target market and a masked or misrepresented connection.
Validate Geo at Every Stage of the Campaign
One of the most common gaps in media buying is only validating geo at the targeting stage. A more effective approach applies geo validation across the full lifecycle of a campaign.
In the pre-bid stage, this means having to exclude impressions from non-target regions, filtering out known proxy or data center traffic, and prioritizing high-confidence geo signals. Once the campaign has moved to an in-flight status, the focus will shift to monitoring delivery patterns and detecting anomalies or unexpected geo distributions. Once the campaign finishes, the process continues by comparing intended versus actual delivery and identifying discrepancies to refine future targeting.
This continuous validation loop ensures that geo accuracy isn’t just assumed, it’s verified.
Prioritize Presence, Not Assumption
Not all IP geolocation location data signals are equal. One of the main differences between them is whether a user is physically in a location or if they are simply associated with it.
To reduce off-target impressions, favor real-time, presence-based geo signals over inferred or outdated location data, and refresh geo signals in longer sessions, namely in CTV.
This is particularly important for campaigns with strict geographic boundaries, such as local advertising, regional compliance, or market-specific messaging.
How to Filter Anonymized Traffic to Reduce Invalid Impressions in CTV
CTV represents one of the fastest-growing and most complex channels in digital media. It also presents unique challenges when it comes to filtering anonymized and invalid traffic.
Understand Where Anonymized Traffic Comes From
In CTV, anonymization often results from:
- SSAI environments that mask device-level signals
- IP obfuscation through proxies or VPNs
- Limited access to persistent identifiers
While not all anonymized traffic is invalid, it does introduce uncertainty, and that uncertainty can lower campaign quality.
Identify and Filter Non-Residential Traffic
A critical step in reducing invalid impressions is distinguishing between residential and non-residential traffic.Non-residential traffic (such as data centers or cloud infrastructure) is more likely to be associated with bot activity, emulated devices, and fraudulent impression generation.
Filtering strategies include blocking known hosting provider ip ranges, flagging traffic with inconsistent or missing device signals, and monitoring for unnatural traffic patterns (e.g., high-volume bursts). Strategies like these are powered by combining NetAcuity’s network classification with Nodify’s real-time proxy and VPN detection giving you a more complete picture of whether traffic is legitimate before a single impression is purchased.
Leverage Device and Network Intelligence
CTV environments require a more nuanced approach to validation.
Key signals to evaluate:
- Device type and authenticity (smart TV vs emulator)
- Network consistency (does the device behavior match the IP environment?)
- Household-level patterns (does usage align with expected behavior?)
When these signals align, confidence in the impression increases. When they don’t, it’s a strong indicator that further filtering is needed.
Apply Pre-Bid Filtering for Maximum Efficiency
The most effective way to reduce invalid impressions is to prevent them from being purchased in the first place.
Pre-bid filtering enables:
- Blocking suspicious traffic before it enters the auction
- Reducing wasted spend on low-quality impressions
- Improving overall campaign efficiency
When combined with post-bid analysis, this creates a robust system for maintaining media quality across channels.
What Geo Checks Reduce False Positives When Blocking Out-of-Market Viewers?
Over-filtering can be just as damaging as under-filtering.
Blocking too aggressively can exclude legitimate users, reducing reach and limiting campaign effectiveness. The key is finding the right balance between precision and flexibility.
Use Confidence-Based Decisioning
Instead of treating geo validation as a binary decision (valid vs. invalid), apply confidence scoring. Be sure to evaluate geo accuracy confidence, proxy likelihood, and network trust level for each impression.
This allows for more nuanced actions: high-confidence impressions can be allowed, medium confidence ones can be monitored or adjusted, and low confidence ones can be blocked or excluded.
This approach reduces unnecessary exclusions while maintaining strong protection against invalid traffic.
Cross-Validate Multiple Signals
Relying on a single signal increases the risk of false positives.
To improve accuracy:
- Compare IP-based geo with ISP data
- Validate time zone alignment
- Analyze behavioral consistency over time
When signals align, confidence increases. When they conflict, impressions can be flagged rather than immediately blocked. Tools like NetAcuity and Nodify work together here. NetAcuity validates geo and network type while Nodify identifies anonymized connections in real time, reducing the risk of acting on a single, potentially misleading signal.
Account for Real-World Edge Cases
Not all anomalies are fraudulent. Legitimate scenarios that can trigger false positives include travelers using mobile networks, households with dynamic IP addresses, and smart TVs connected through shared networks
To account for these, allow for reasonable geo variance (e.g., radius-based targeting), use historical data to validate consistency, and avoid over-penalizing mobile carrier traffic.
This ensures that real users aren’t unintentionally excluded.
Why This Matters for the Future of Media Buying
As media ecosystems become more complex, data integrity becomes a competitive advantage. Without reliable validation, campaign performance metrics can’t be trusted, optimization decisions become less effective, and budget allocation becomes increasingly inefficient.
On the other hand, organizations that invest in high-quality geo intelligence, advanced traffic validation, and multi-layered filtering strategies are better positioned to reach real audiences with precision, reduce wasted spend, and make smarter, data-driven decisions.

Where Digital Element Fits Into Your Media Strategy
Reducing off-target and invalid impressions requires more than surface-level filtering. It demands trusted, high-quality IP intelligence that works across every stage of media buying.
That’s where Digital Element comes in.
How Digital Element Supports More Accurate Media Buying
1. High-Precision Geo Targeting: Granular location data at the ZIP, city, and DMA level, helping ensure impressions are served to users who are actually within your intended market.
2. Anonymized Traffic Identification: With built-in proxy and VPN detection, NetAcuity and Nodify help identify masked or anonymized connections that can distort campaign performance and inflate reach metrics.
3. Network & Connection Intelligence: By classifying IPs as residential, mobile, or data center, you can enable smarter filtering to reduce invalid impressions without overblocking legitimate users.
4. Scalable Pre- and Post-Bid Activation: Whether applied pre-bid to prevent wasted spend or post-bid for validation and reporting, our products integrate seamlessly into existing media workflows.
Take Control of Your Media Quality with Digital Element
By partnering with Digital Element, you gain access to trusted IP intelligence that helps ensure every impression is grounded in accurate, real-world data. IP data intelligence from Digital Element can empower your team to reach the right audiences, filter out low-quality traffic, and make better decisions based on reliable insights.
If you’re ready to take a more precise, data-driven approach to media buying, now is the time to act. Request a free consultation to see how our tools can help you reduce wasted impressions, strengthen campaign performance, and bring greater confidence to your results.